Reading a signature
The Signature tab presents a place's environmental variables in accordions, one per band. This page explains how to read what's displayed — the numbers, badges, bars, and small charts. It does not explain how to operate the Sandbox (see Overview) or what individual variables mean (see the Codebook).
One basin or many
The single thing that determines how a signature looks is how many basins the query covers.
If you ask about a settlement without a buffer, the answer comes from one basin. Every variable has exactly one value, and the display shows that value and where it sits globally.
If you add a buffer, or ask about a polity, the answer comes from a set of basins — sometimes a handful, sometimes hundreds. There is no single value any more. What EDOPS shows instead is a summary of the distribution across those basins, plus a chart of the distribution itself.
This is a consequence of the scope you choose, not of what kind of place you asked about. A settlement with a wide buffer produces the same kind of display as a small polity.
Numeric variables
One basin
You get the measured value, its global percentile, and a marker showing that percentile on a line:
Precip Yr —
762 mm/yr · 63.6 percentile

The percentile is global. Each basin's raw value is ranked against every other basin worldwide at the resolution level you queried — not against the region, not against the scope. A reading of 63.6 means this basin is wetter than 63.6% of all basins on Earth.
Many basins
You get an area-weighted percentile, a concentrated or spread badge, and a histogram of how the constituent basins are distributed:
Aridity —
59.1 percentile· spread

Temp Yr Upstream —
33.8 percentile· concentrated

The headline percentile is the area-weighted mean of each contributing basin's own percentile — larger basins pull it further. The two numbers flanking the histogram are the 10th and 90th percentiles of that distribution: the middle-80% range, expressed in percentile points rather than in the variable's own units.
The badge summarises how much the basins disagree. Under 20 percentile points between p10 and p90 is concentrated — the area is environmentally consistent in this respect. Twenty or more is spread — the area contains real internal variation, and the headline number is an average over genuinely different places.
Both badges are informative. Spread is not a warning; for a large polity it is often the expected and interesting result.
Reading the histogram
The shape tells you how many basins are in the query. A handful of tall isolated bars means a small set — a buffered settlement, or a compact polity. A smooth mound means a large one. In a small set, individual bars are individual basins and you can see the clustering directly; in a large set the distribution's shape is what matters.
Note that a wide range and a spread badge are not the same thing. The range endpoints tell you where the extremes fall; the badge tells you whether the bulk of the area agrees.
Categorical variables
Categorical variables — biome, lithology, land cover, wetland class — have no percentile. They show the most common class across the query area and the share of the area holding that class:
Biome —
Temperate Broadleaf & Mixed Forests· 71%

For a single basin this is always 100%: one basin has one majority class. For a set, the percentage is what matters. A share of 97% means the area is essentially uniform. A share of 44% means the named class is merely the largest of several, and more than half the area is something else — the label alone would be misleading, and the bar is what stops you being misled.
Only the leading class is shown, not the full mixture.
Extremes and single-basin selections
A few variables are not averaged at all. Where a variable represents a maximum or a defining feature, the display reports the value from the single basin carrying it, along with that basin's identifier, and no chart. These read as one value even for a large query, because they describe one basin's contribution rather than a summary of all of them.
When a value is missing
An em-dash (—) means no value is being reported. It does not mean zero. Zero is a real
measurement and displays as 0.
For a single-basin query this usually means the variable isn't coded for that basin — as with karst, permafrost, or the wetland groups in areas where those datasets have no coverage.
Karst (no value)

In a multi-basin query, an empty headline can mean three different things, and the label tells you which:
- A bare dash with an empty histogram means no basin in the query area had the variable at all — the same no-coverage case as above, just spread across a set of basins instead of one.
-
"score suppressed — bimodal," with the histogram still shown, means the contributing basins split into two genuinely different clusters rather than one continuous distribution. A single percentile would average across that split and misrepresent both halves, so none is reported — read the histogram directly instead.

-
"outside active range," with the histogram still shown, means the variable is present but essentially absent everywhere in the query area — for example, permafrost extent for a region with almost no permafrost. This is not missing data; the underlying values are genuinely at or near zero across nearly the whole area, and a percentile isn't a meaningful way to represent that.

The date stamp
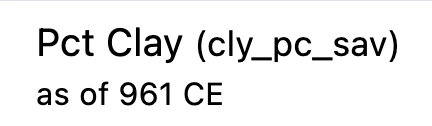
Where a query has a temporal component, each variable label carries a small as of NNNN CE note.
This records the year the query resolved to. For variables in the persistence bands the value itself
is contemporary — the stamp tells you the period the query was about, not the period the measurement
comes from. How far a contemporary measurement can be carried back is what the bands encode; see
Premises and commitments.
Band T is different
Band T does not use any of the above. Its variables come from datasets that are genuinely indexed to time, and each source has its own display:
-
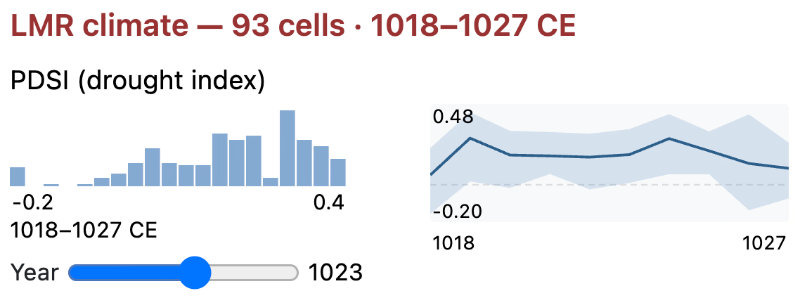
LMR — annual series charts for temperature, precipitation, and drought index, with a year slider and a small distribution summary. The header reports how many LMR grid cells intersect the query area and the year range covered.
-
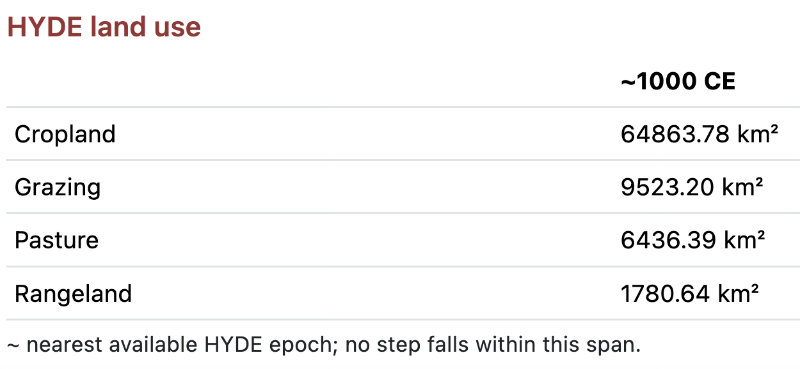
HYDE — a table of land-use extents at the selected year.
-
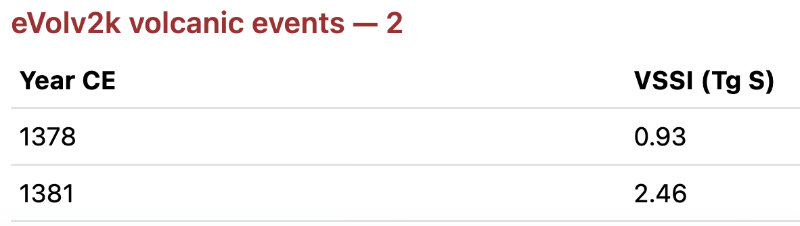
eVolv2k — a list of volcanic events in the period with their sulfur injection values.
None of these carry percentiles, badges, or global rankings. They are values in time, not positions in a global distribution, and they are read accordingly.
The count in the Band T accordion header counts values, not variables — it will be much larger than the counts on the other bands.